Big Data Solutions. Scalable platforms for high-volume data.
Data platforms for collecting, processing and analyzing large information flows.

What it can look like. Screens from systems like this.
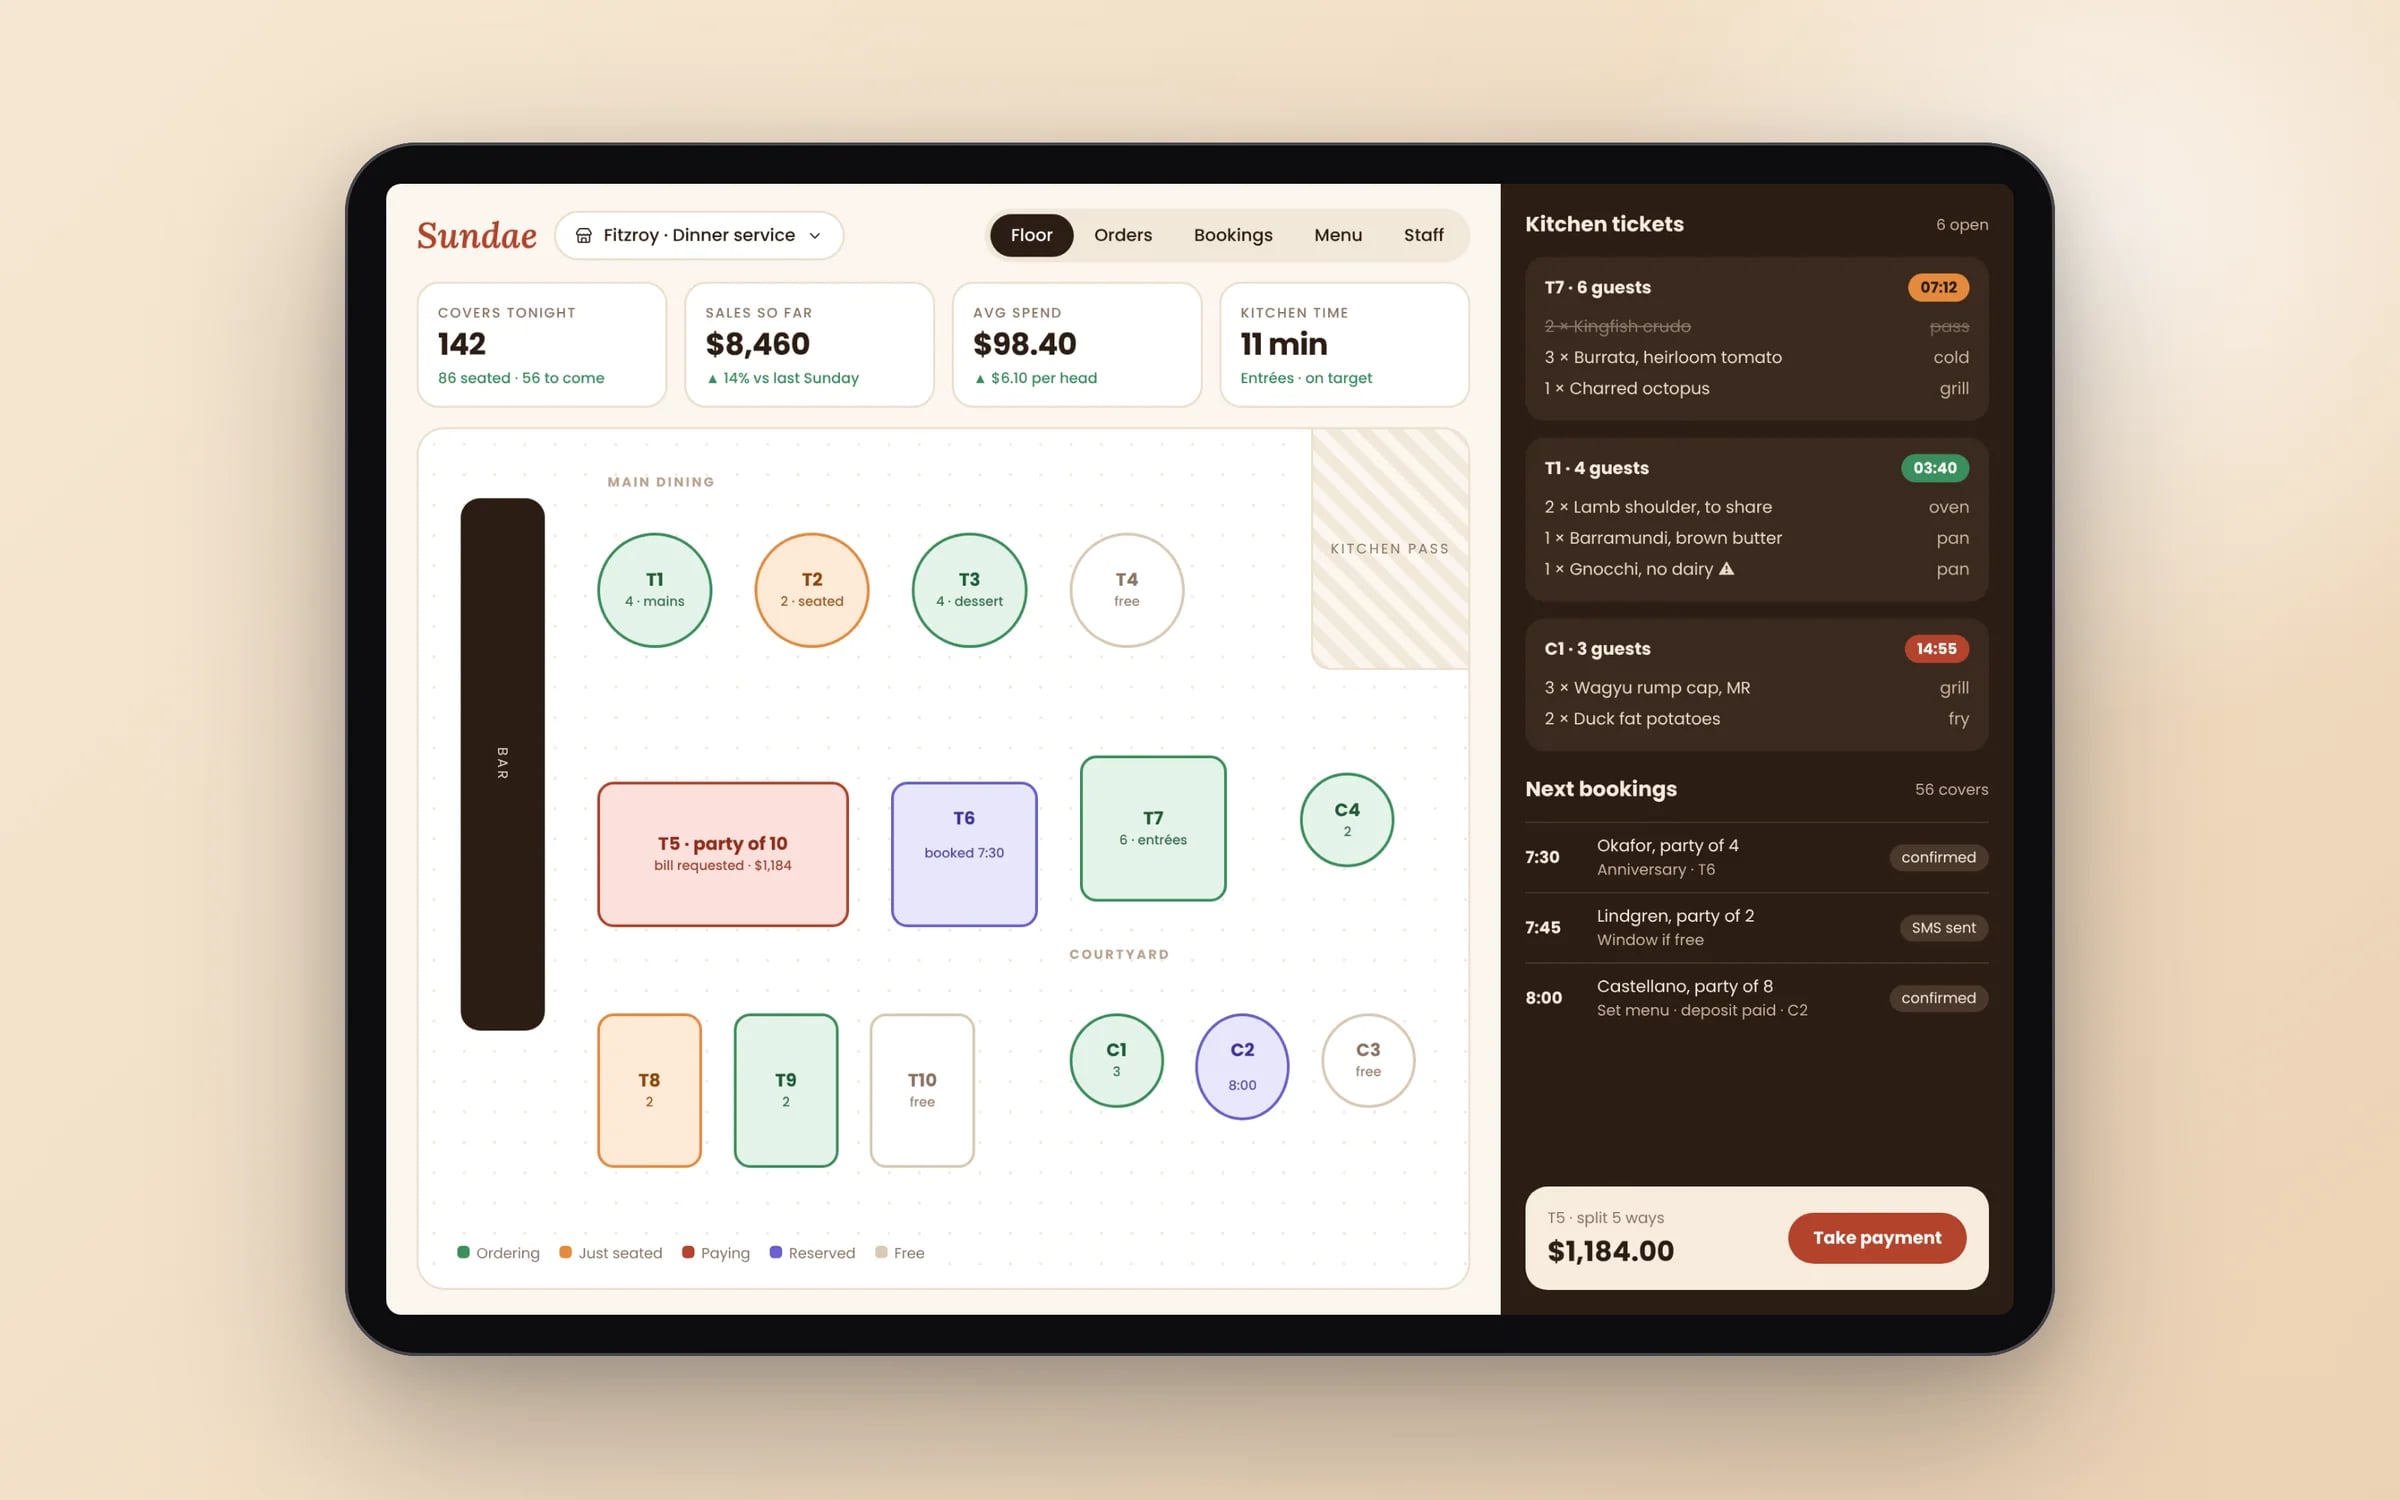
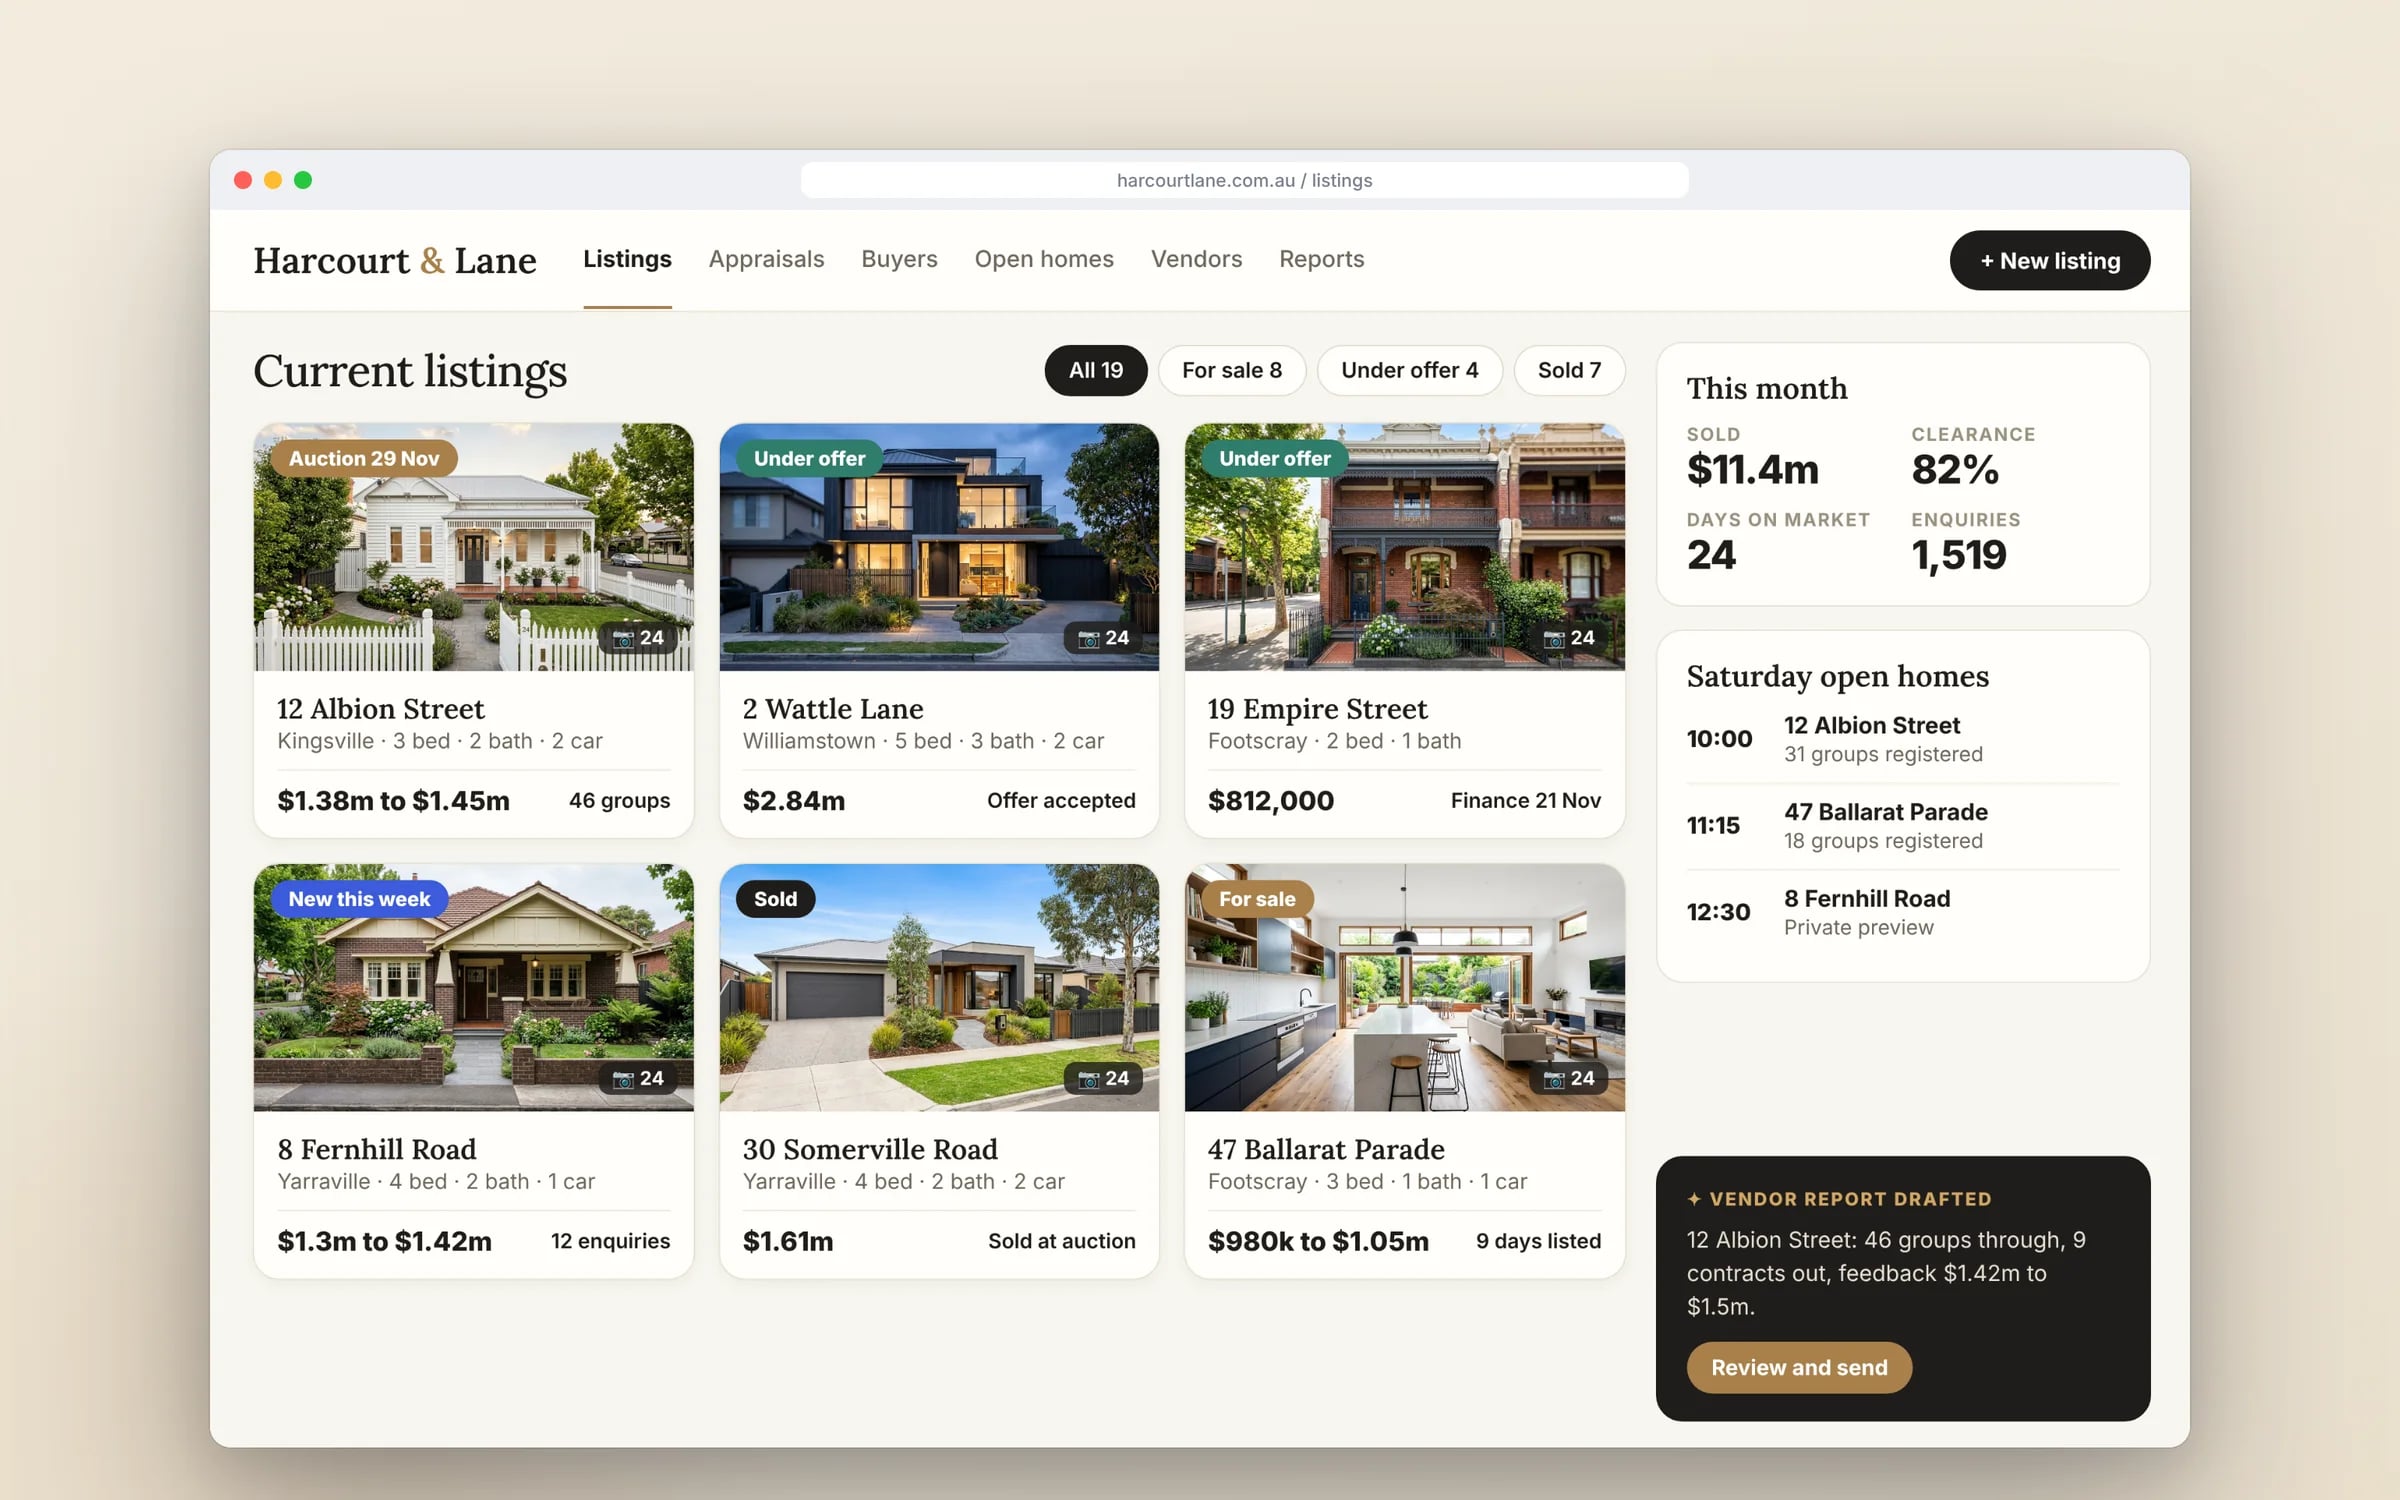
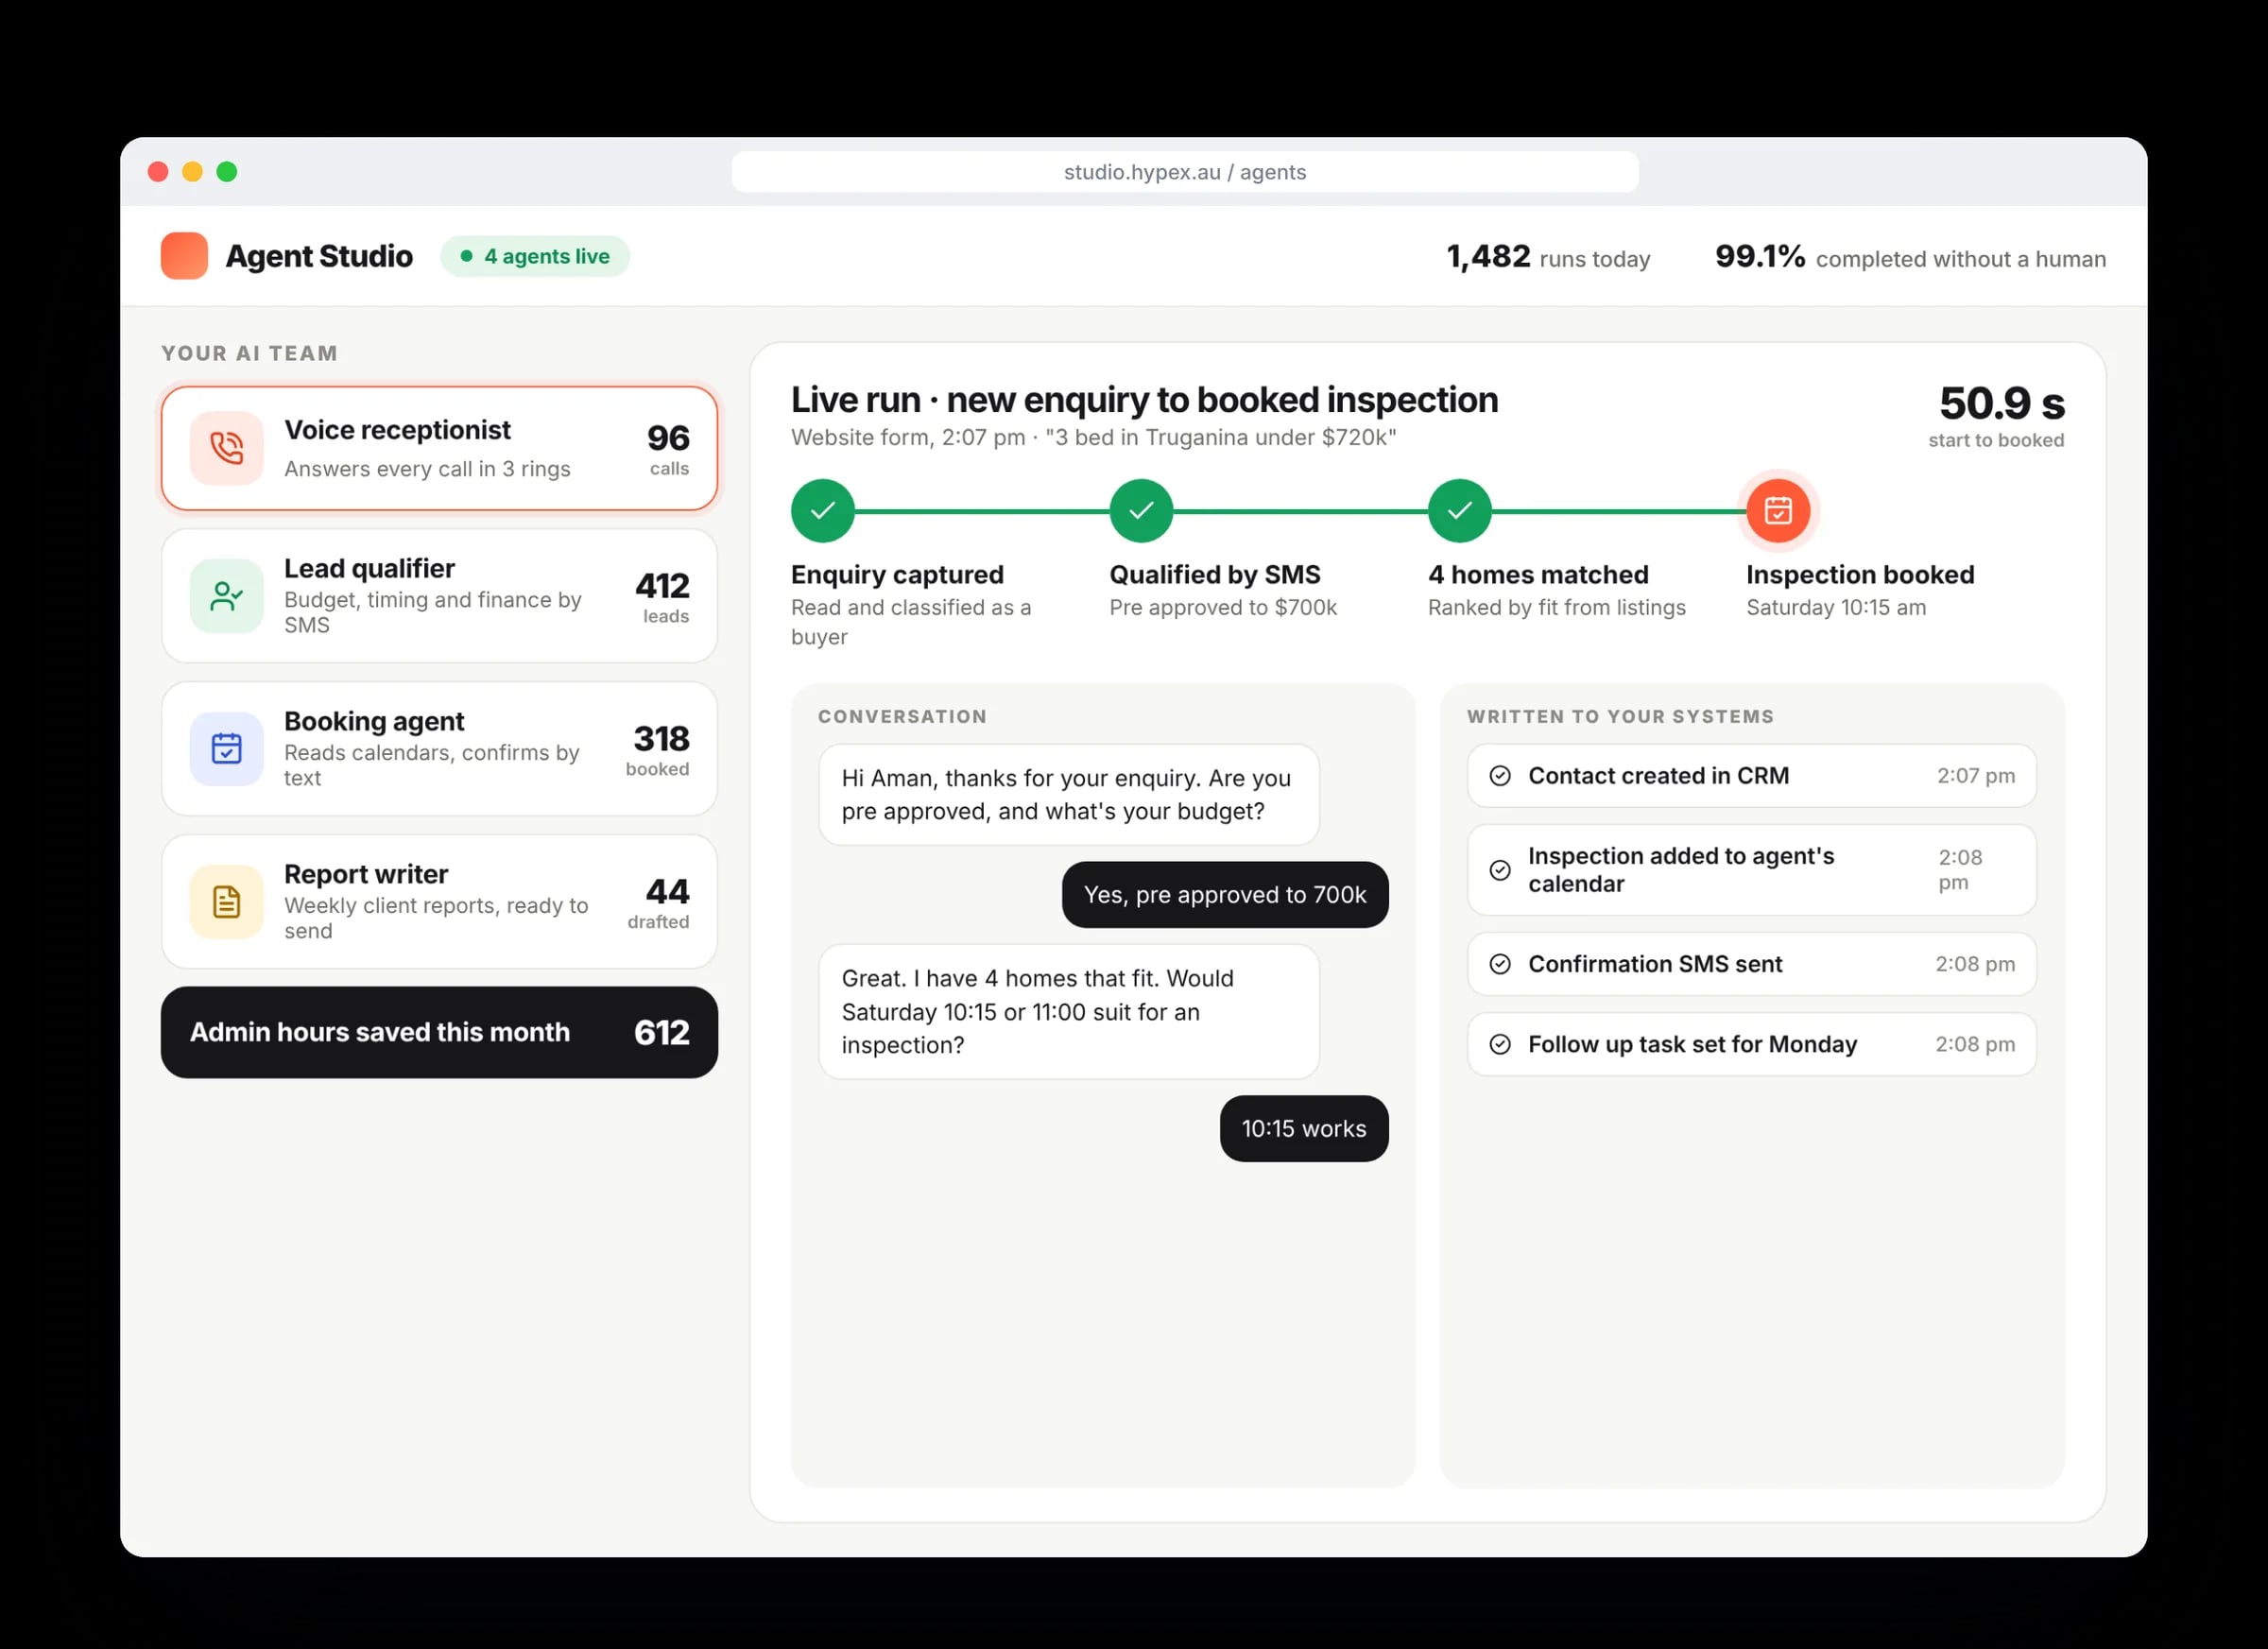
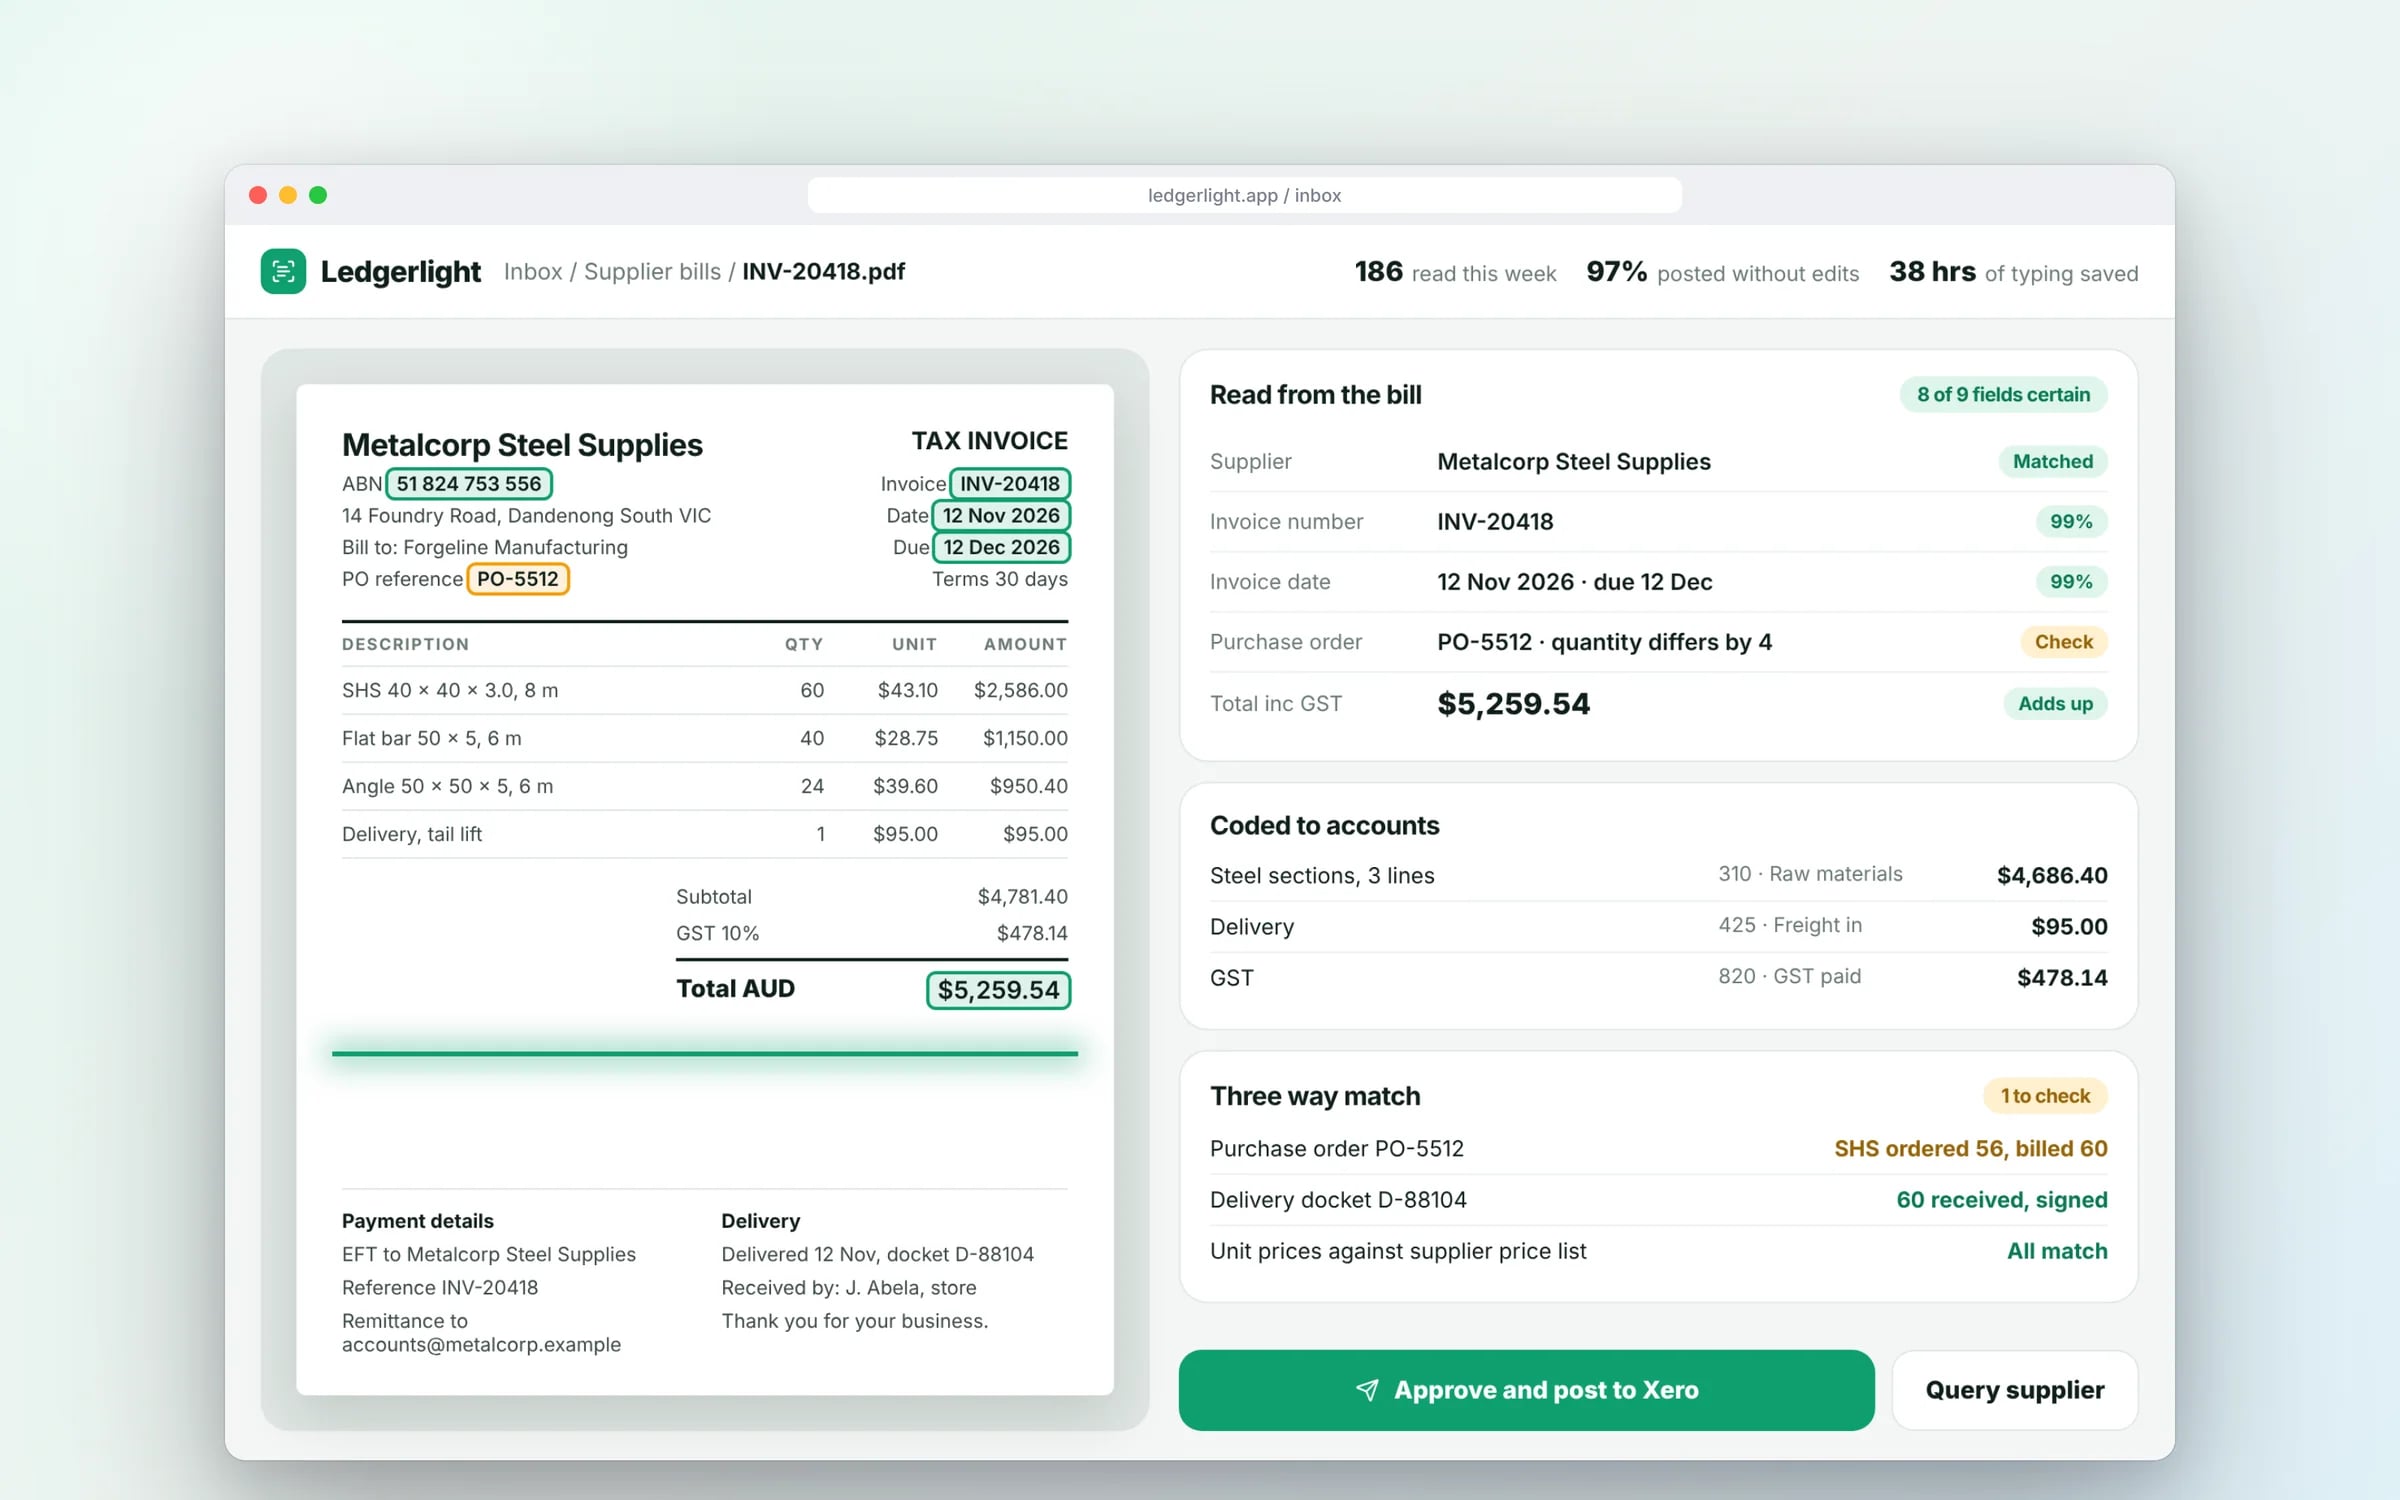
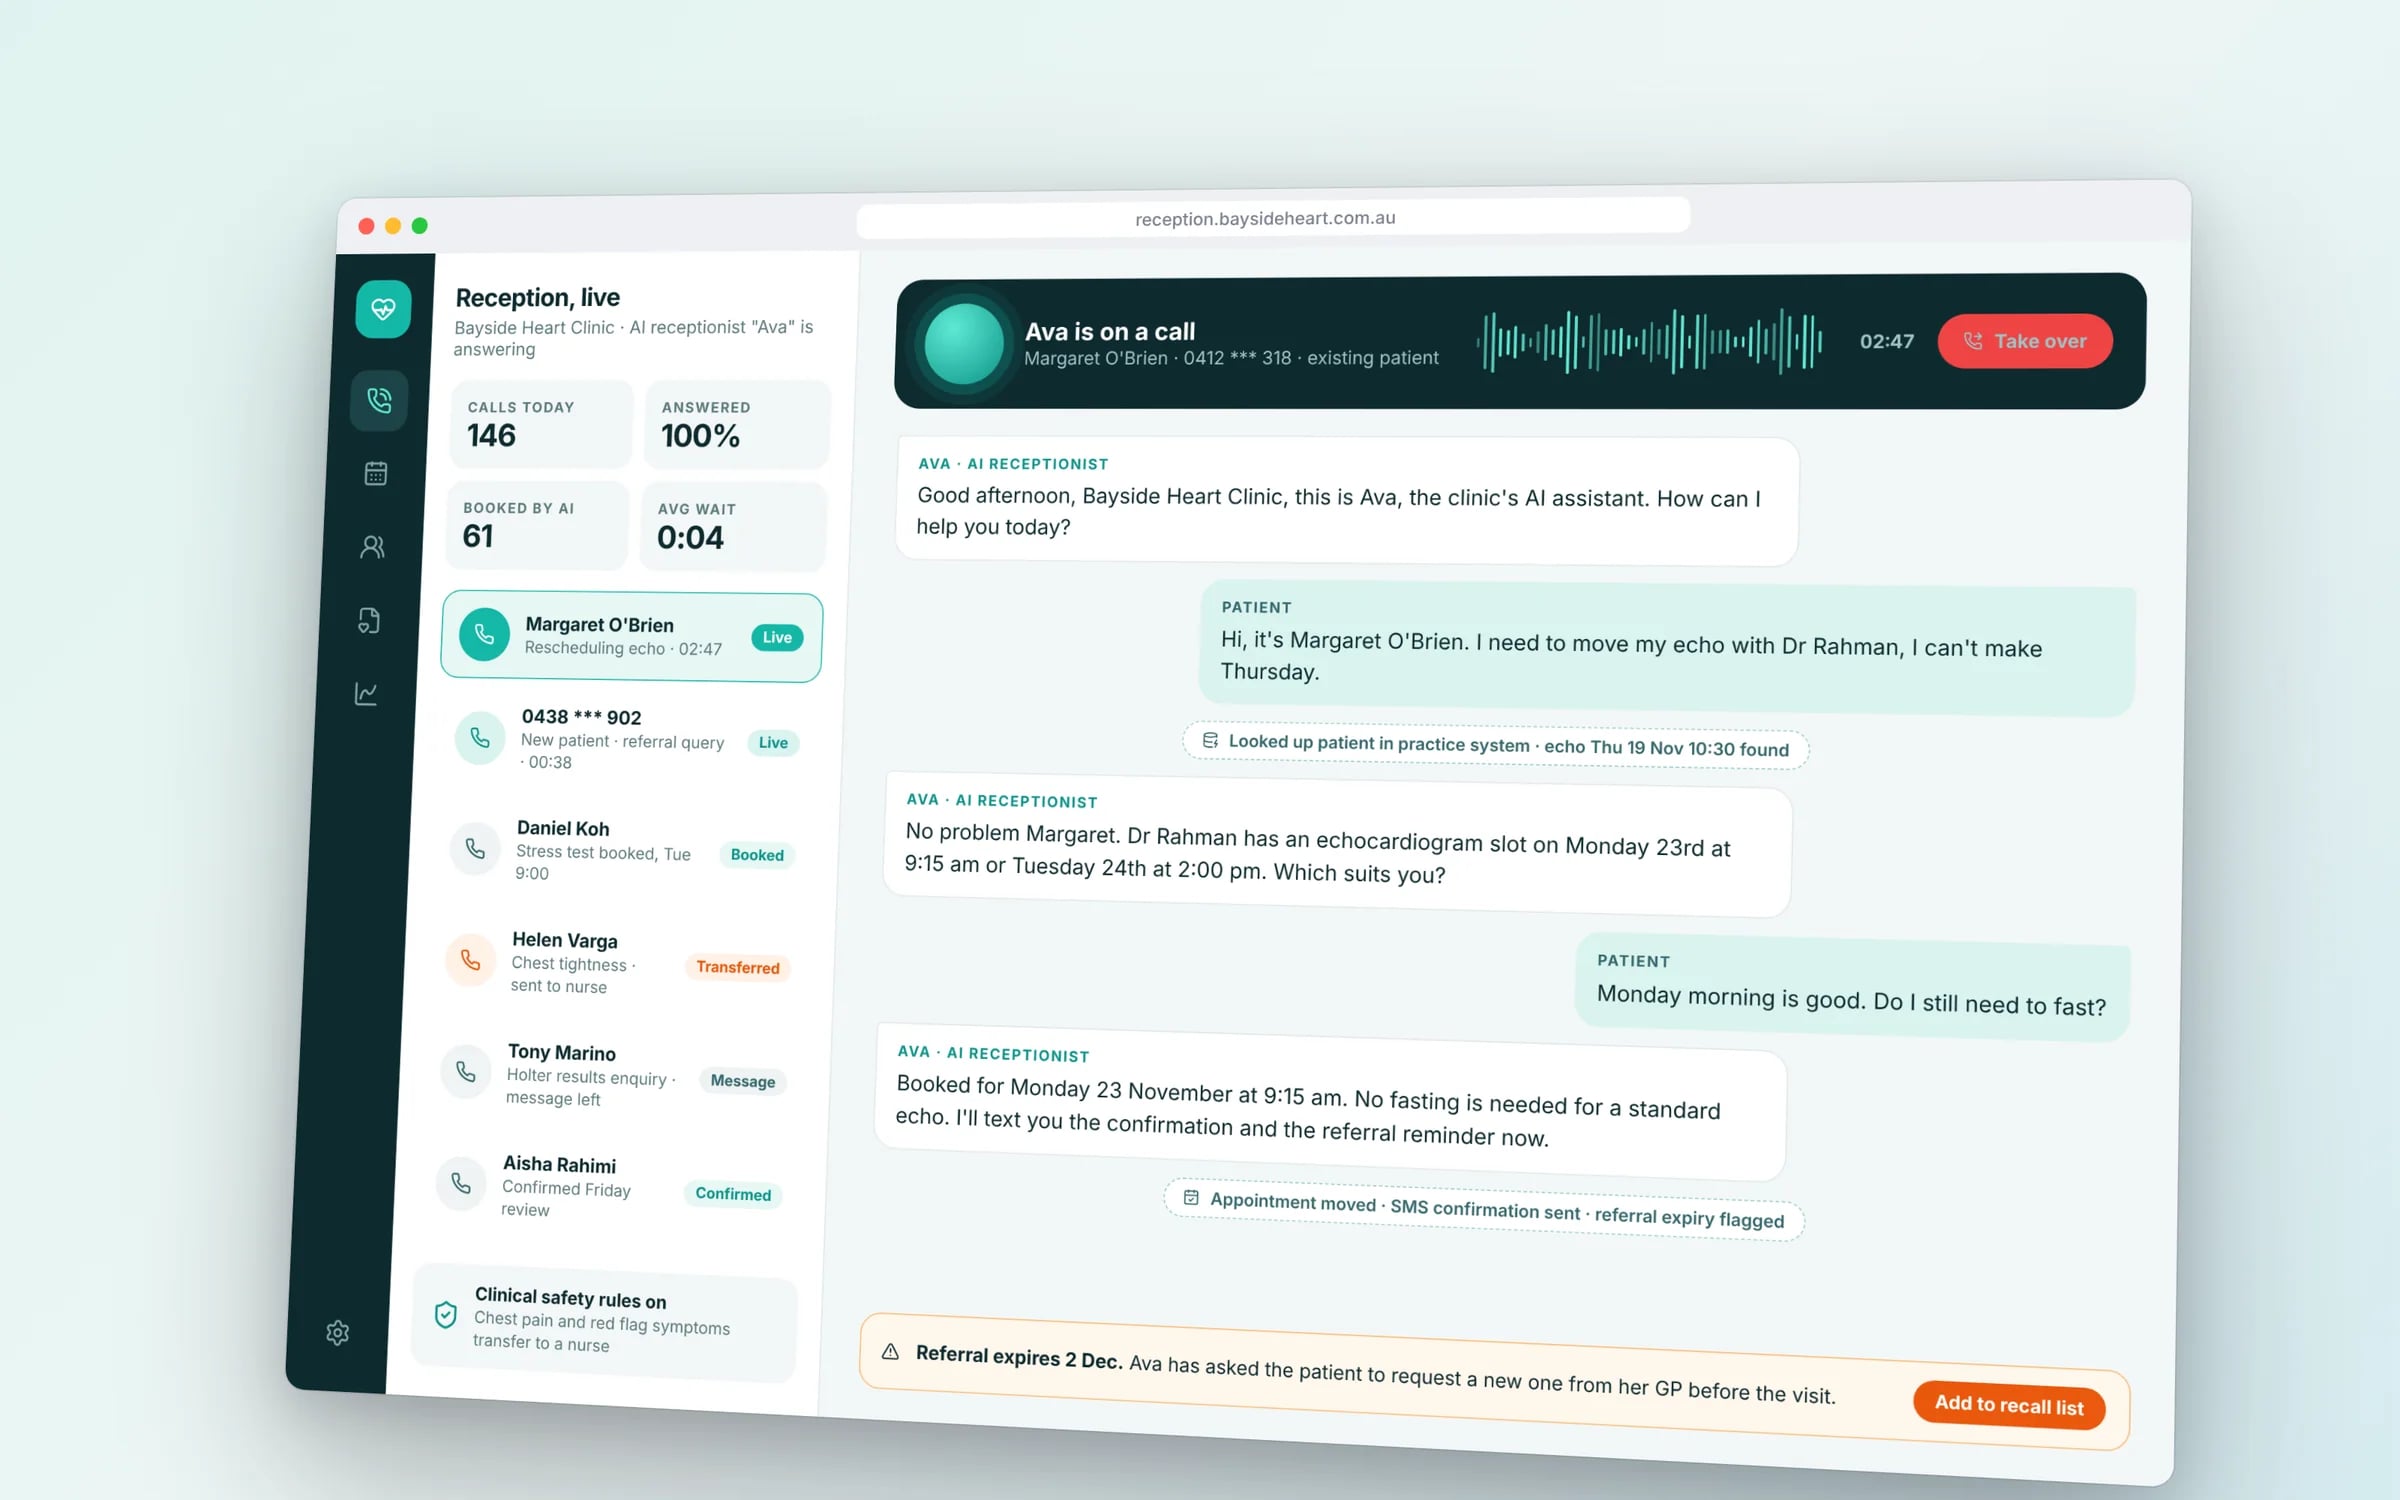
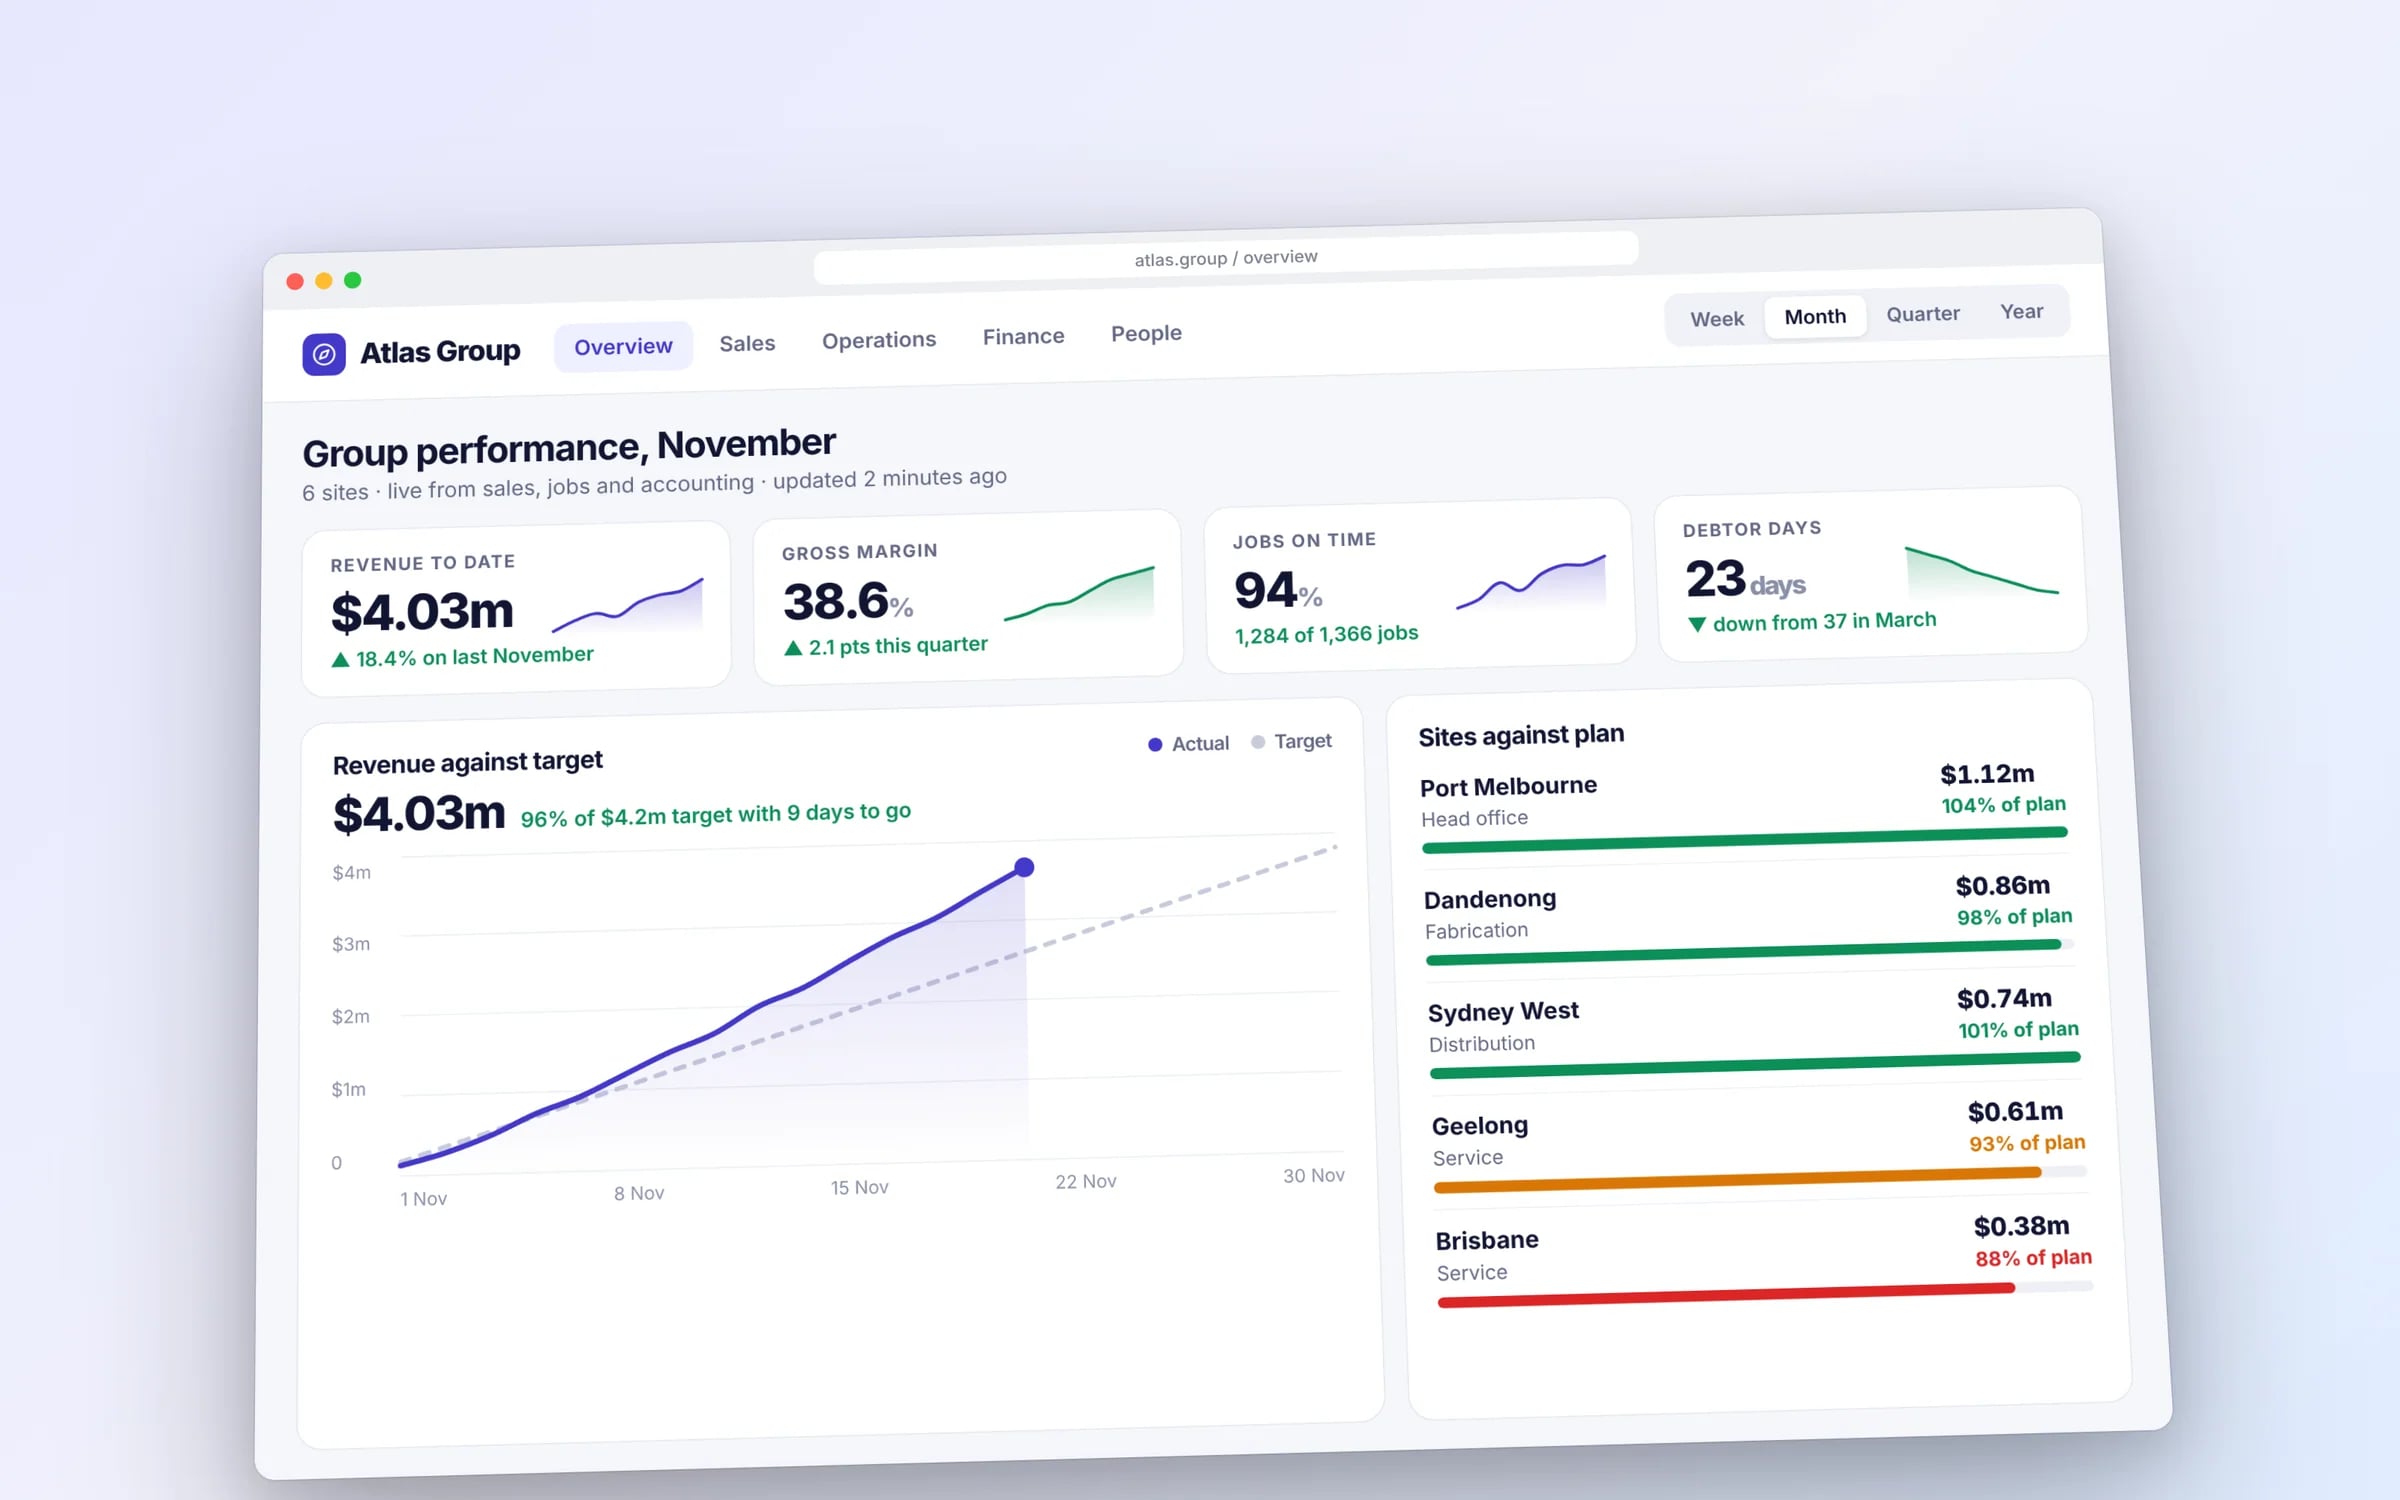
Example screens. The business names on them are invented.
You probably need this when
- 01Month-end reports take days of exporting and joining spreadsheets.
- 02Two managers bring different revenue figures to the same meeting.
- 03You cannot see margin by customer, job or product without a manual exercise.
- 04Data from your online store, accounts and CRM never meets in one place.
- 05You want forecasting or AI, but your records are scattered and inconsistent.
Click a number, see its source. The query, the records, the time.
Every figure on the dashboard carries its lineage, so a board report can be checked back to the records it was built from.
How we'd build it.
- Step 1
Agree the questions and definitions
We start from the decisions you need data for and write down how each measure, such as gross margin, is calculated.
- Step 2
Connect the sources
Pipelines pull from Xero, MYOB, Shopify, HubSpot or your own systems on a schedule, with failures flagged.
- Step 3
Model and check the data
Records are cleaned, matched and checked against figures your finance team already trusts.
- Step 4
Publish reports and extend
Dashboards go live for the first set of questions, then more sources and uses are added in stages.
★★★★★
“Great team to work with, really strive for success and provide excellent communication with any service provided.”
How we do it.
- 01Big dataScalable processing and analytics.
Where the admin hours go. And what an agent takes off them.
- Re-keying invoices and bills9 h/wk
- Chasing quotes and follow-ups7 h/wk
- Copying job notes between apps6 h/wk
- Building the weekly report4 h/wk
Illustrative: a typical week for an office team of five. An agent drafts or does each of these; a person approves.
What is Big Data Solutions?
A big data solution is a data platform that collects records from all your systems into one place, cleans and joins them, and makes them available for reporting, forecasting and AI.
It suits businesses whose numbers live across Xero, a CRM, an ecommerce store and spreadsheets, where month-end reporting takes days and nobody fully trusts the totals.
Reviewed by the Hypex team, Port Melbourne
Questions owners ask.
Do we have enough data to need a data platform?
You need a data platform when your data is spread across several systems and answering a simple question means exporting and joining spreadsheets, whatever the total volume. Most established businesses do not have big data in the technical sense. What they have is scattered data: sales in Shopify, costs in Xero, jobs in a field service app and stock in a spreadsheet. Bringing those together into one model, refreshed automatically, is what makes reliable reporting possible. The same platform can grow to handle sensor feeds or high transaction volumes later.
What is the difference between a data warehouse and a data lake?
A data warehouse stores cleaned, structured data organised for reporting, while a data lake stores raw data of any type in its original form for later processing. A warehouse is where your finance and operations dashboards read from, because the tables are already joined and defined. A lake is useful when you collect large volumes of logs, files or sensor readings and do not yet know every way you will use them. Many platforms combine both, an approach often called a lakehouse. For most mid-sized businesses, a well-designed warehouse is the right starting point.
What is an ETL pipeline?
An ETL pipeline is an automated process that extracts data from your systems, transforms it into a consistent shape, and loads it into a central store. Extract might pull invoices from Xero and orders from Shopify through their APIs. Transform might match customers across both and apply your definition of gross margin. Load writes the result into the warehouse on a schedule. A common variant, ELT, loads the raw data first and transforms it inside the warehouse. Either way, the pipeline replaces the manual export and paste routine that month-end reporting often depends on.
Can we keep using Power BI or Looker Studio with a data platform?
Yes, a data platform usually feeds whichever reporting tool your team already knows, such as Power BI, Looker Studio or Tableau, or a dashboard built into your own system. The tool matters less than the model underneath it. When revenue, margin and job counts are defined once in the warehouse, every report uses the same numbers, and the arguments about whose spreadsheet is right stop. We set the definitions with your finance and operations leads before building dashboards, so the first reports match how you already measure the business.
How do you keep a data platform compliant with the Privacy Act?
A data platform stays on the right side of the Privacy Act by collecting only the personal information you need, limiting who can see it, and keeping it secure. Under the Australian Privacy Principles you should know what personal information you hold, why you hold it and where it is stored. We tag personal fields, mask or exclude them from general reporting, and set role-based access so a sales dashboard does not expose customer contact details to everyone. The platform runs in a cloud account your business owns, encrypted in transit and at rest, in an Australian region if you choose.
Data warehouse vs data lake.
- What it stores
Data warehouseCleaned, structured tables such as orders, invoices and jobs
Data lakeRaw data in any format, including logs, files and sensor readings
- When structure is applied
Data warehouseBefore data is loaded
Data lakeWhen the data is read or processed
- Typical users
Data warehouseFinance, operations and managers using dashboards
Data lakeEngineers and analysts preparing data for models or deep analysis
- Best for
Data warehouseConsistent reporting with agreed business definitions
Data lakeLarge or varied data you will process in different ways later
- Main risk
Data warehouseBecomes rigid if definitions are designed poorly
Data lakeBecomes a disorganised dump without clear ownership and rules
What moves the cost and the timeline.
After a 30-minute call you get a system map with a fixed price for each stage, before any work starts. These are the things that shape it.
- The number of source systems and whether they have usable APIs
- How messy and inconsistent the existing records are
- How often data must refresh, from daily to near real time
- Privacy and access requirements for personal or sensitive data
Built for businesses like yours
Show us how you run it today.
Thirty minutes with the people who would build it. We'll map where the hours go and tell you honestly whether custom software is worth it for you.